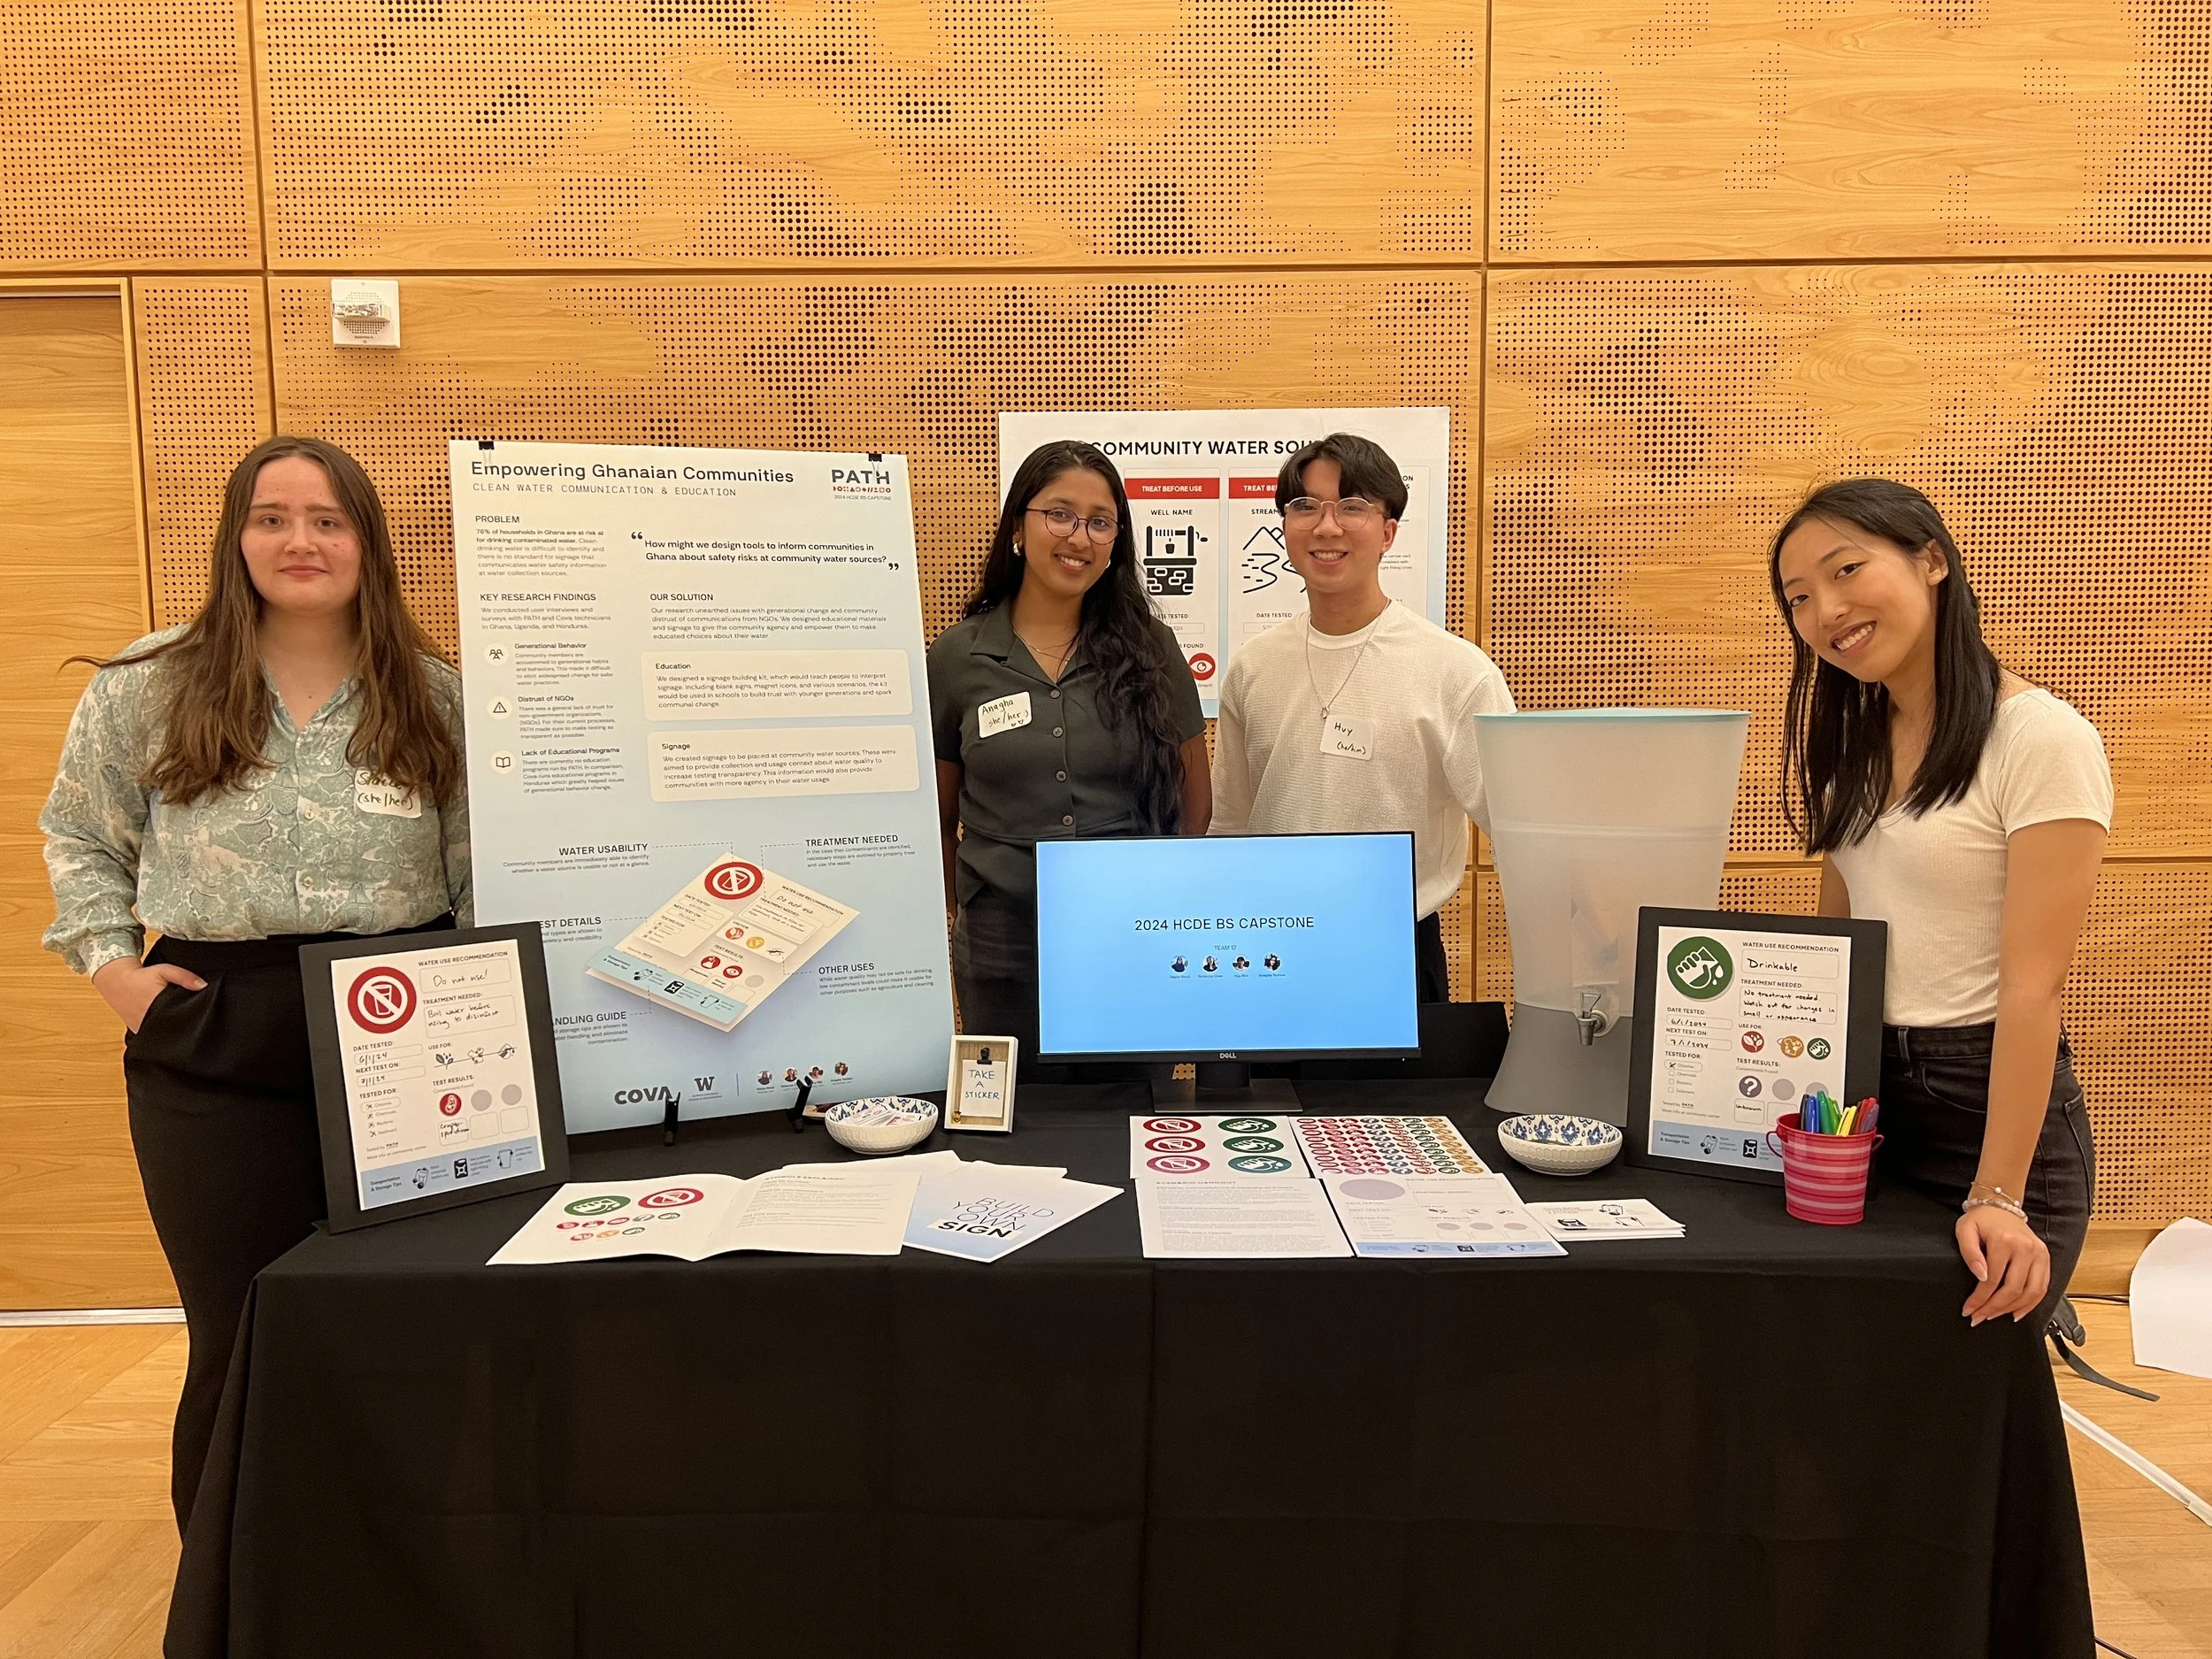
Educational Toolkit and Signage Design
Safe Water Comnunication
Industry Capstone Project at The University of Washington
We designed signage & educational tools because
76% of households in Ghana are at risk of drinking contaminated water.
Access to water in Ghana is extremely varied; piped water directly to a household is rare. In rural Ghana, a community may have 1-3 public sources of water where people can fetch their household's water.
We tackled the issue of communicating if water at these community water sources is safe to drink through signage, and targeted educational programs that show how water is contaminated and what to do if water is not safe to drink.
The Design Question
“How might we design communication strategies to help water quality facilitators in Central America and Africa convey information about water quality?”
Build your own signage toolkit and
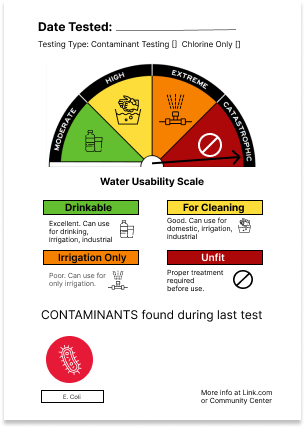
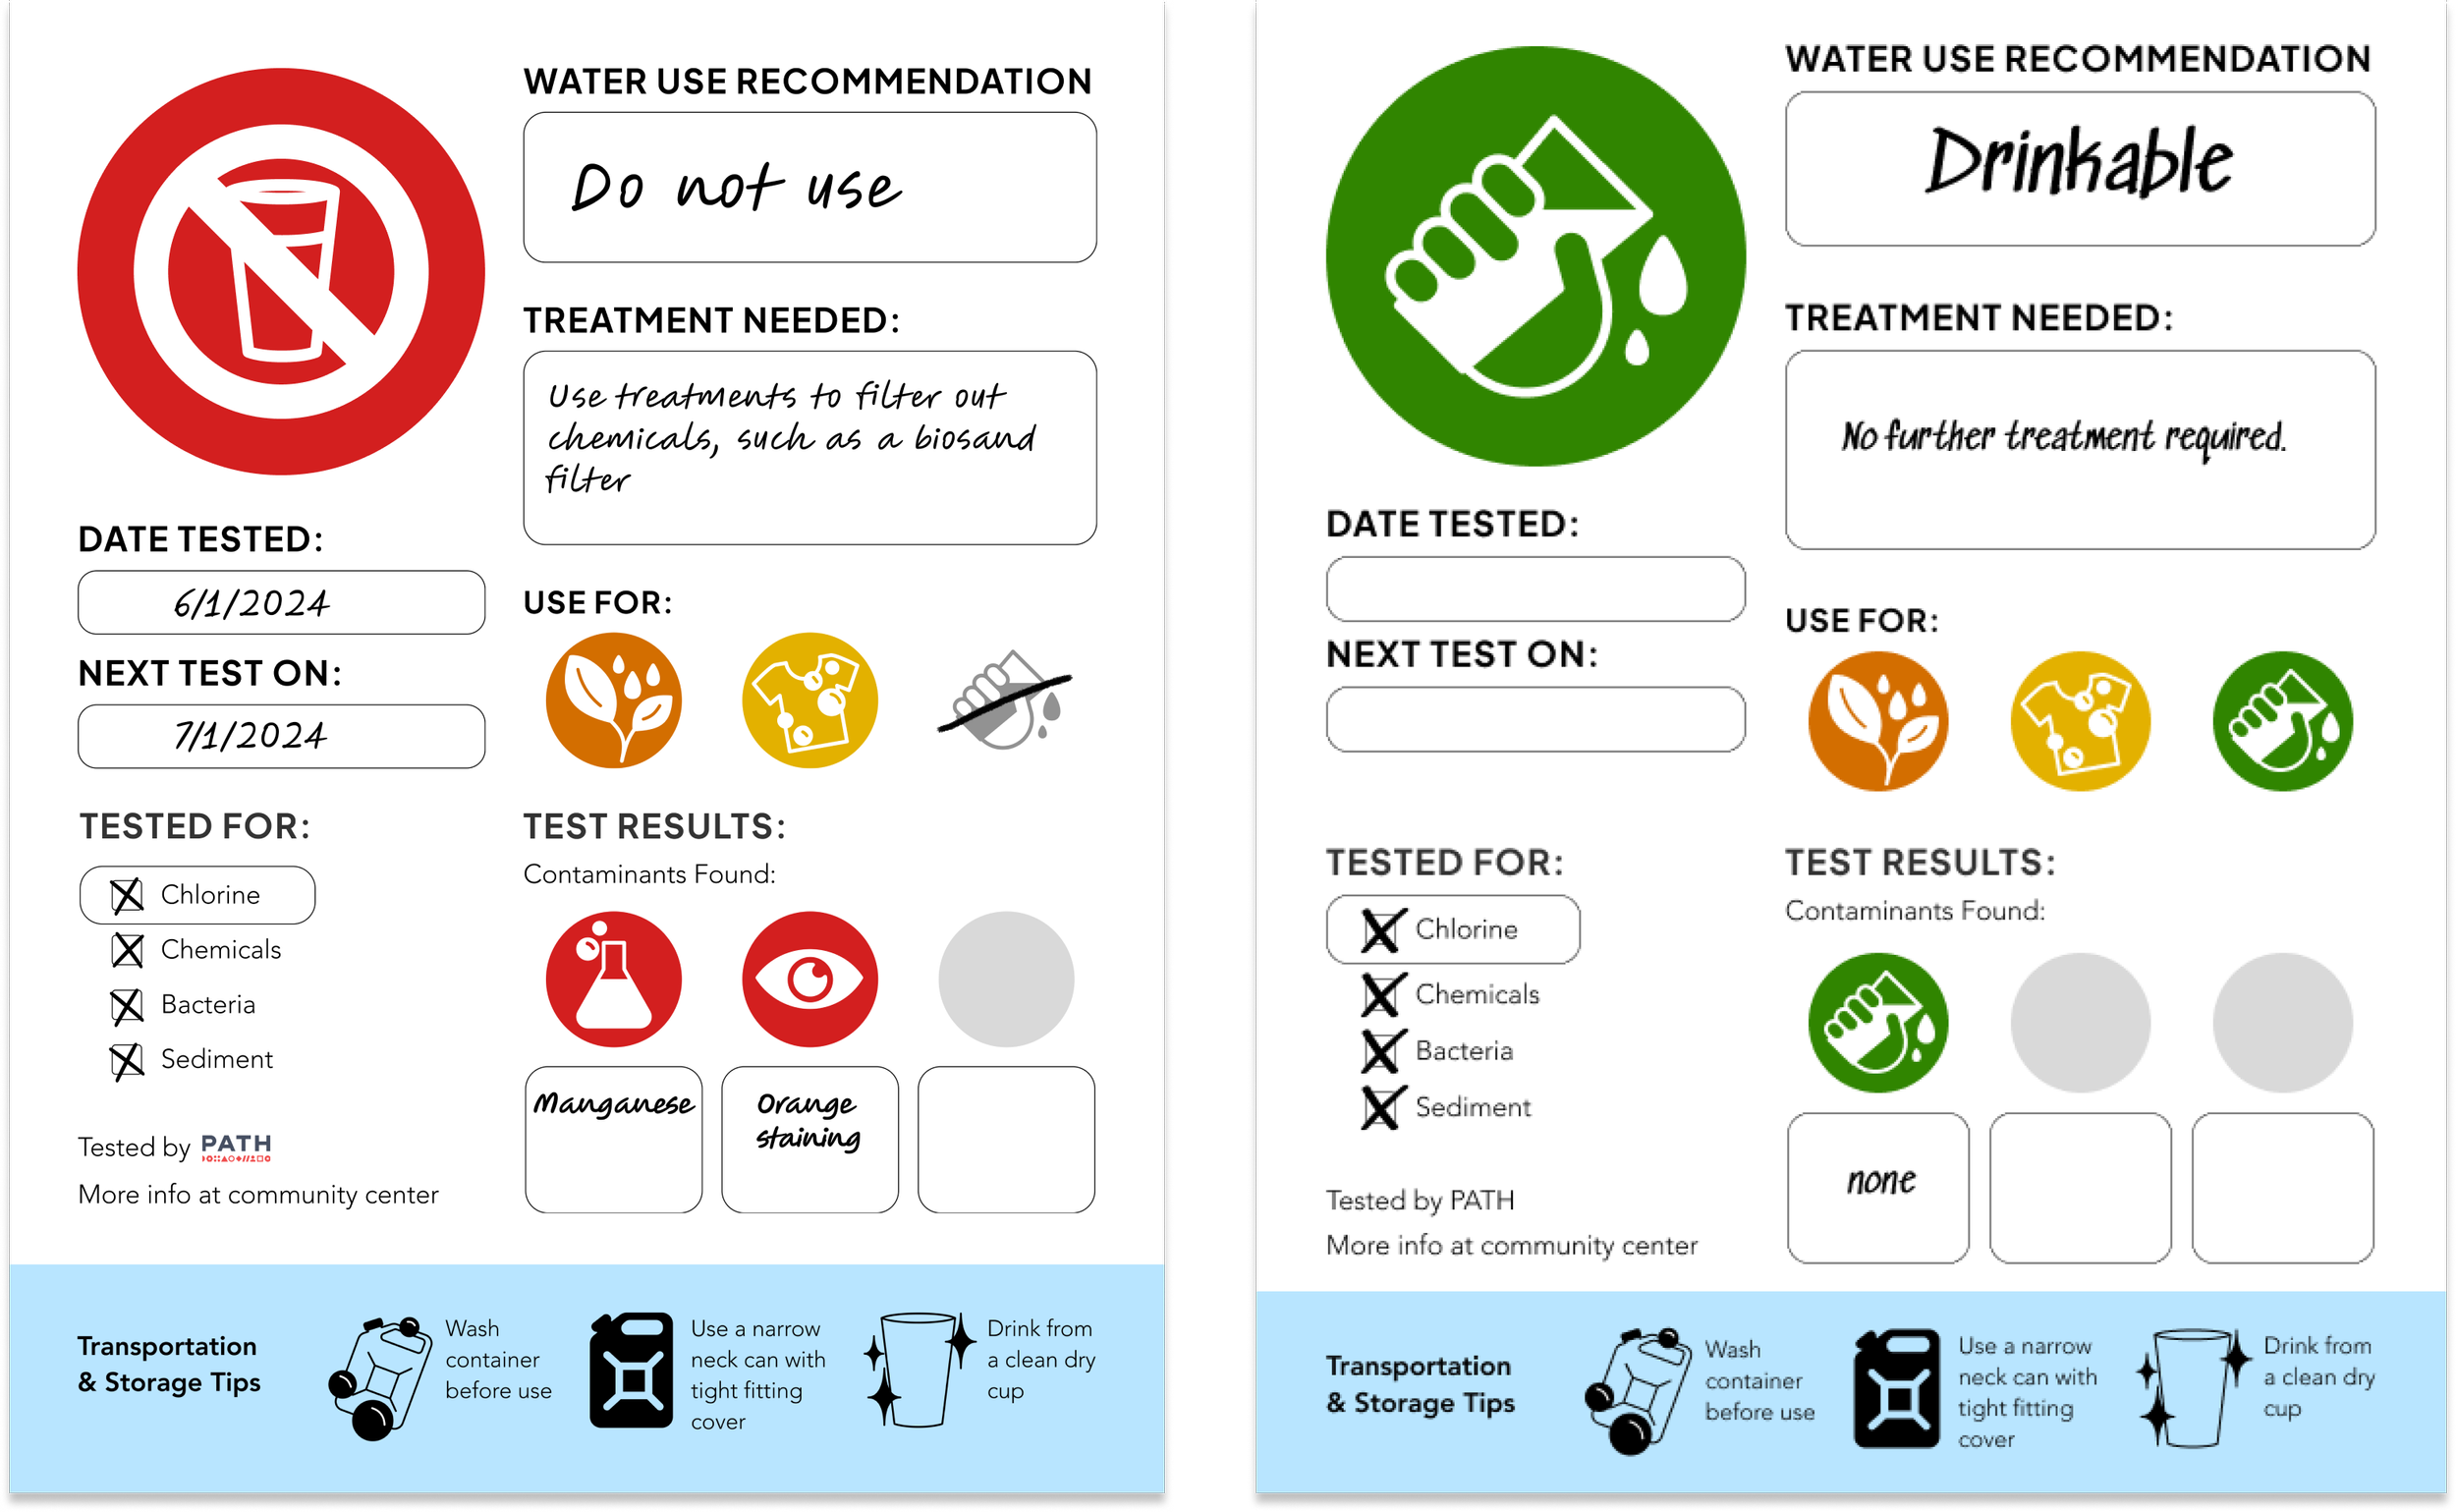
Final Signage Prototypes

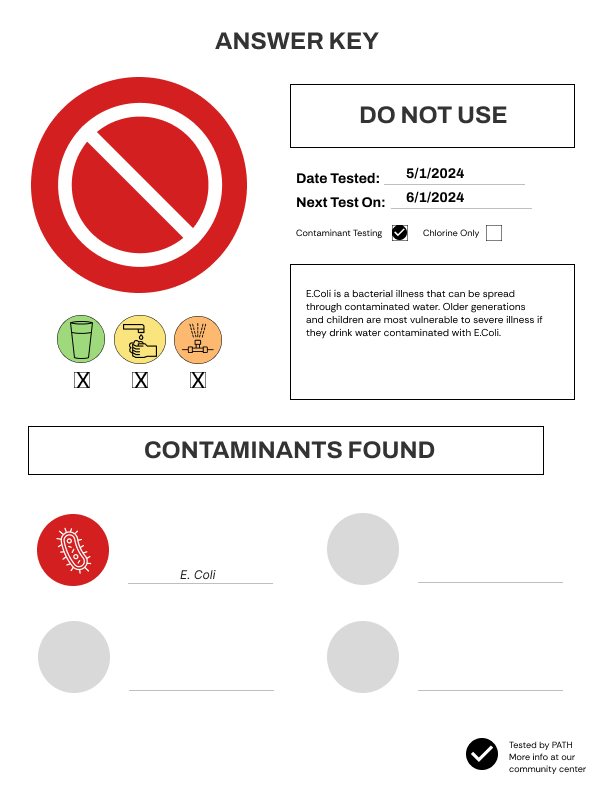
Above are the final educational toolkit signage prototypes. They come blank, and can be written on to communicate water quality.
*The toolkit also includes icon stickers that are added to top left, USE FOR, and TEST RESULTS sections.
Designed to be used in schools and communities
Educational Prototypes for Pilot Programs
Role: Lead Designer (Lead Prototype Design, Content Design)
Project Duration: 12 weeks
Result: Our design solution included a full education water safety toolkit for community members and schools, and modular signage prototypes for water safety technicians to educate communities about water quality at water collection sources.
Our sponsors at PATH expressed interest in launching a pilot program using the educational materials we created.
My main role was to work on the design of prototypes and content design for educational activity scenarios.
User Research & Defining Scope
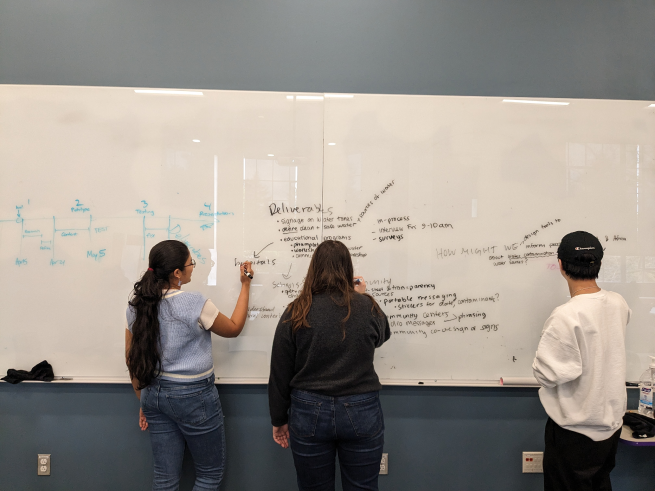
The challenges conducting research across international time zones
In this project, we conducted international user research with water quality technicians in Ghana and Honduras.
We conducted semi-structured user interviews and a qualitative and quantitative survey.
Logistical Challenges
We encountered some scheduling challenges due to translation and logistics— so we had to revise our Gantt Chart Timeline to accommodate for the project changes and focus on the end goal.
Participants: Clean water program employees from PATH (Ghana) and Cova (Honduras)
User Research Findings
Lack of generational change & education
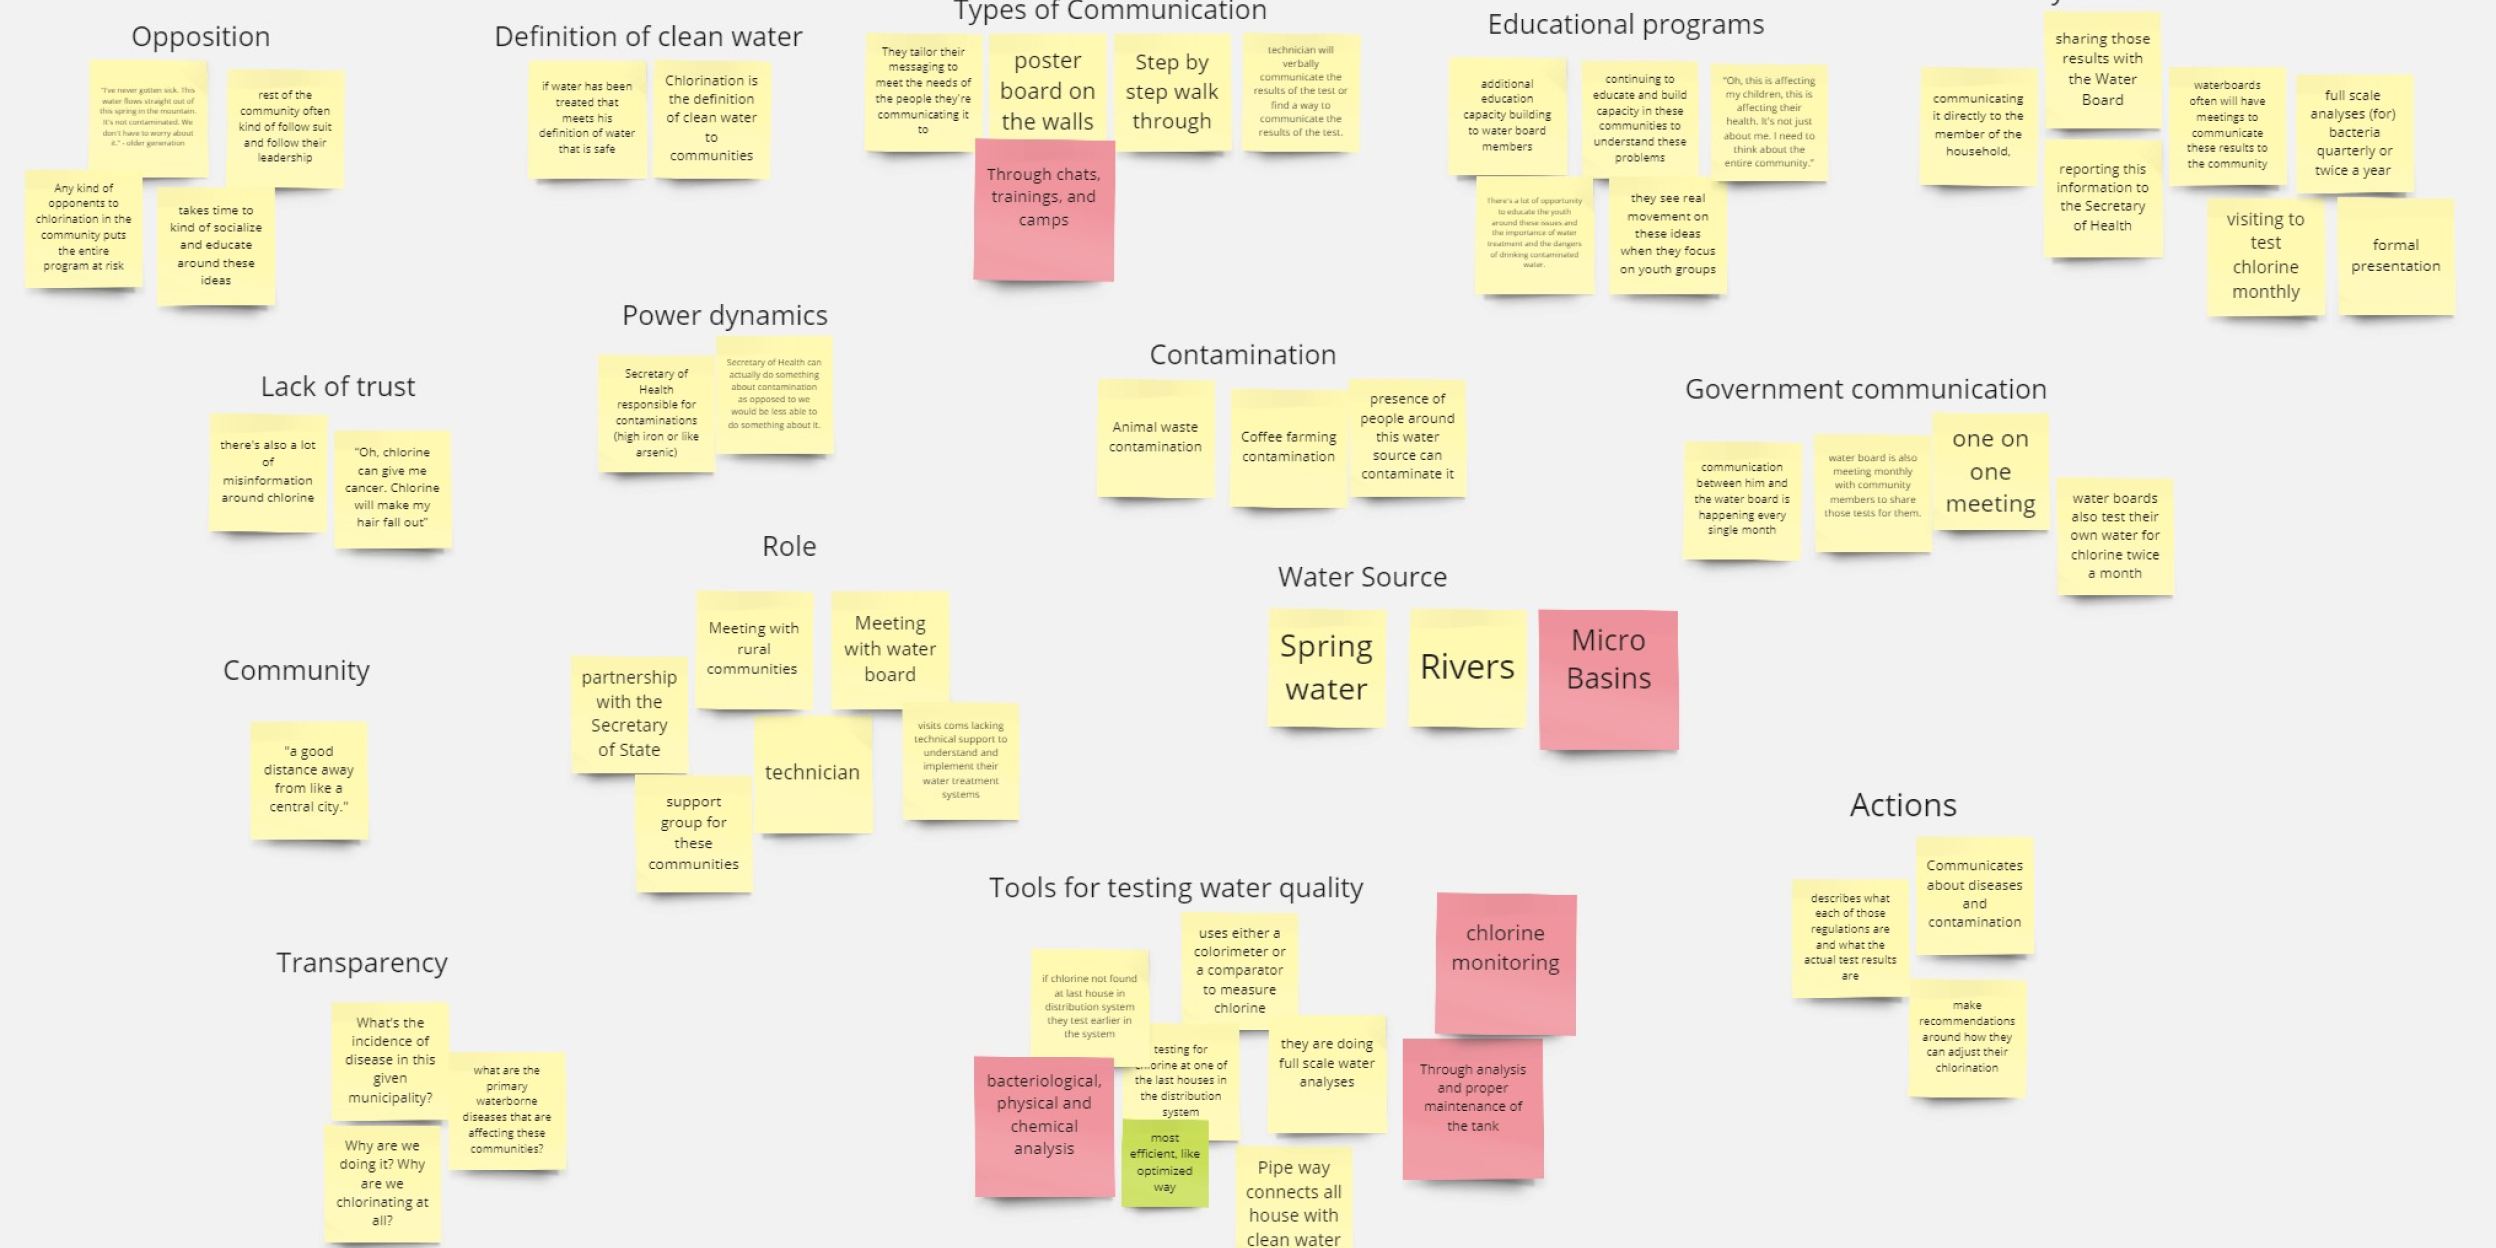
After conducting user interviews with technicians in Honduras and Ghana, we synthesized our results into categories below.
Three Key Findings

Generational Behaviour
Even with communication, members of the communities were accustomed to generational habits and behaviors. This made it difficult to elicit widespread change for safer water practices.
Distrust of NGOs
There was a general lack of trust for non-government organizations (NGOs). Any current testing of water sources by PATH was done in front of all community members and made as transparent as possible to reduce this.
Lack of educational programs
There were no current formal educations programs run by PATH. We spoke with their partner, Cova, who runs water educational programs in Honduras. This greatly helped their communication and behavior change efforts.
Further Narrowing Project Scope
Good design solutions are specific

At this point in the process we were synthesizing our results from user research, and trying to decide how to narrow our scope for a design solution. This was a good learning experience that good design solutions are specific, and solve specific problems.
In narrowing scope, we considered factors such as:
-Signage Locations
-Signage Audience
-Definition of Clean Water
This lead to a new design question—->
The New Design Question
“How might we design tools to inform people in Ghana about water contamination risks at community water sources?”
We designed educational tools to inform people of water safety risks
Usability Testing & Design Iteration
Early prototype version
Prototype Iteration: Including Symbols to communicate about Water Quality
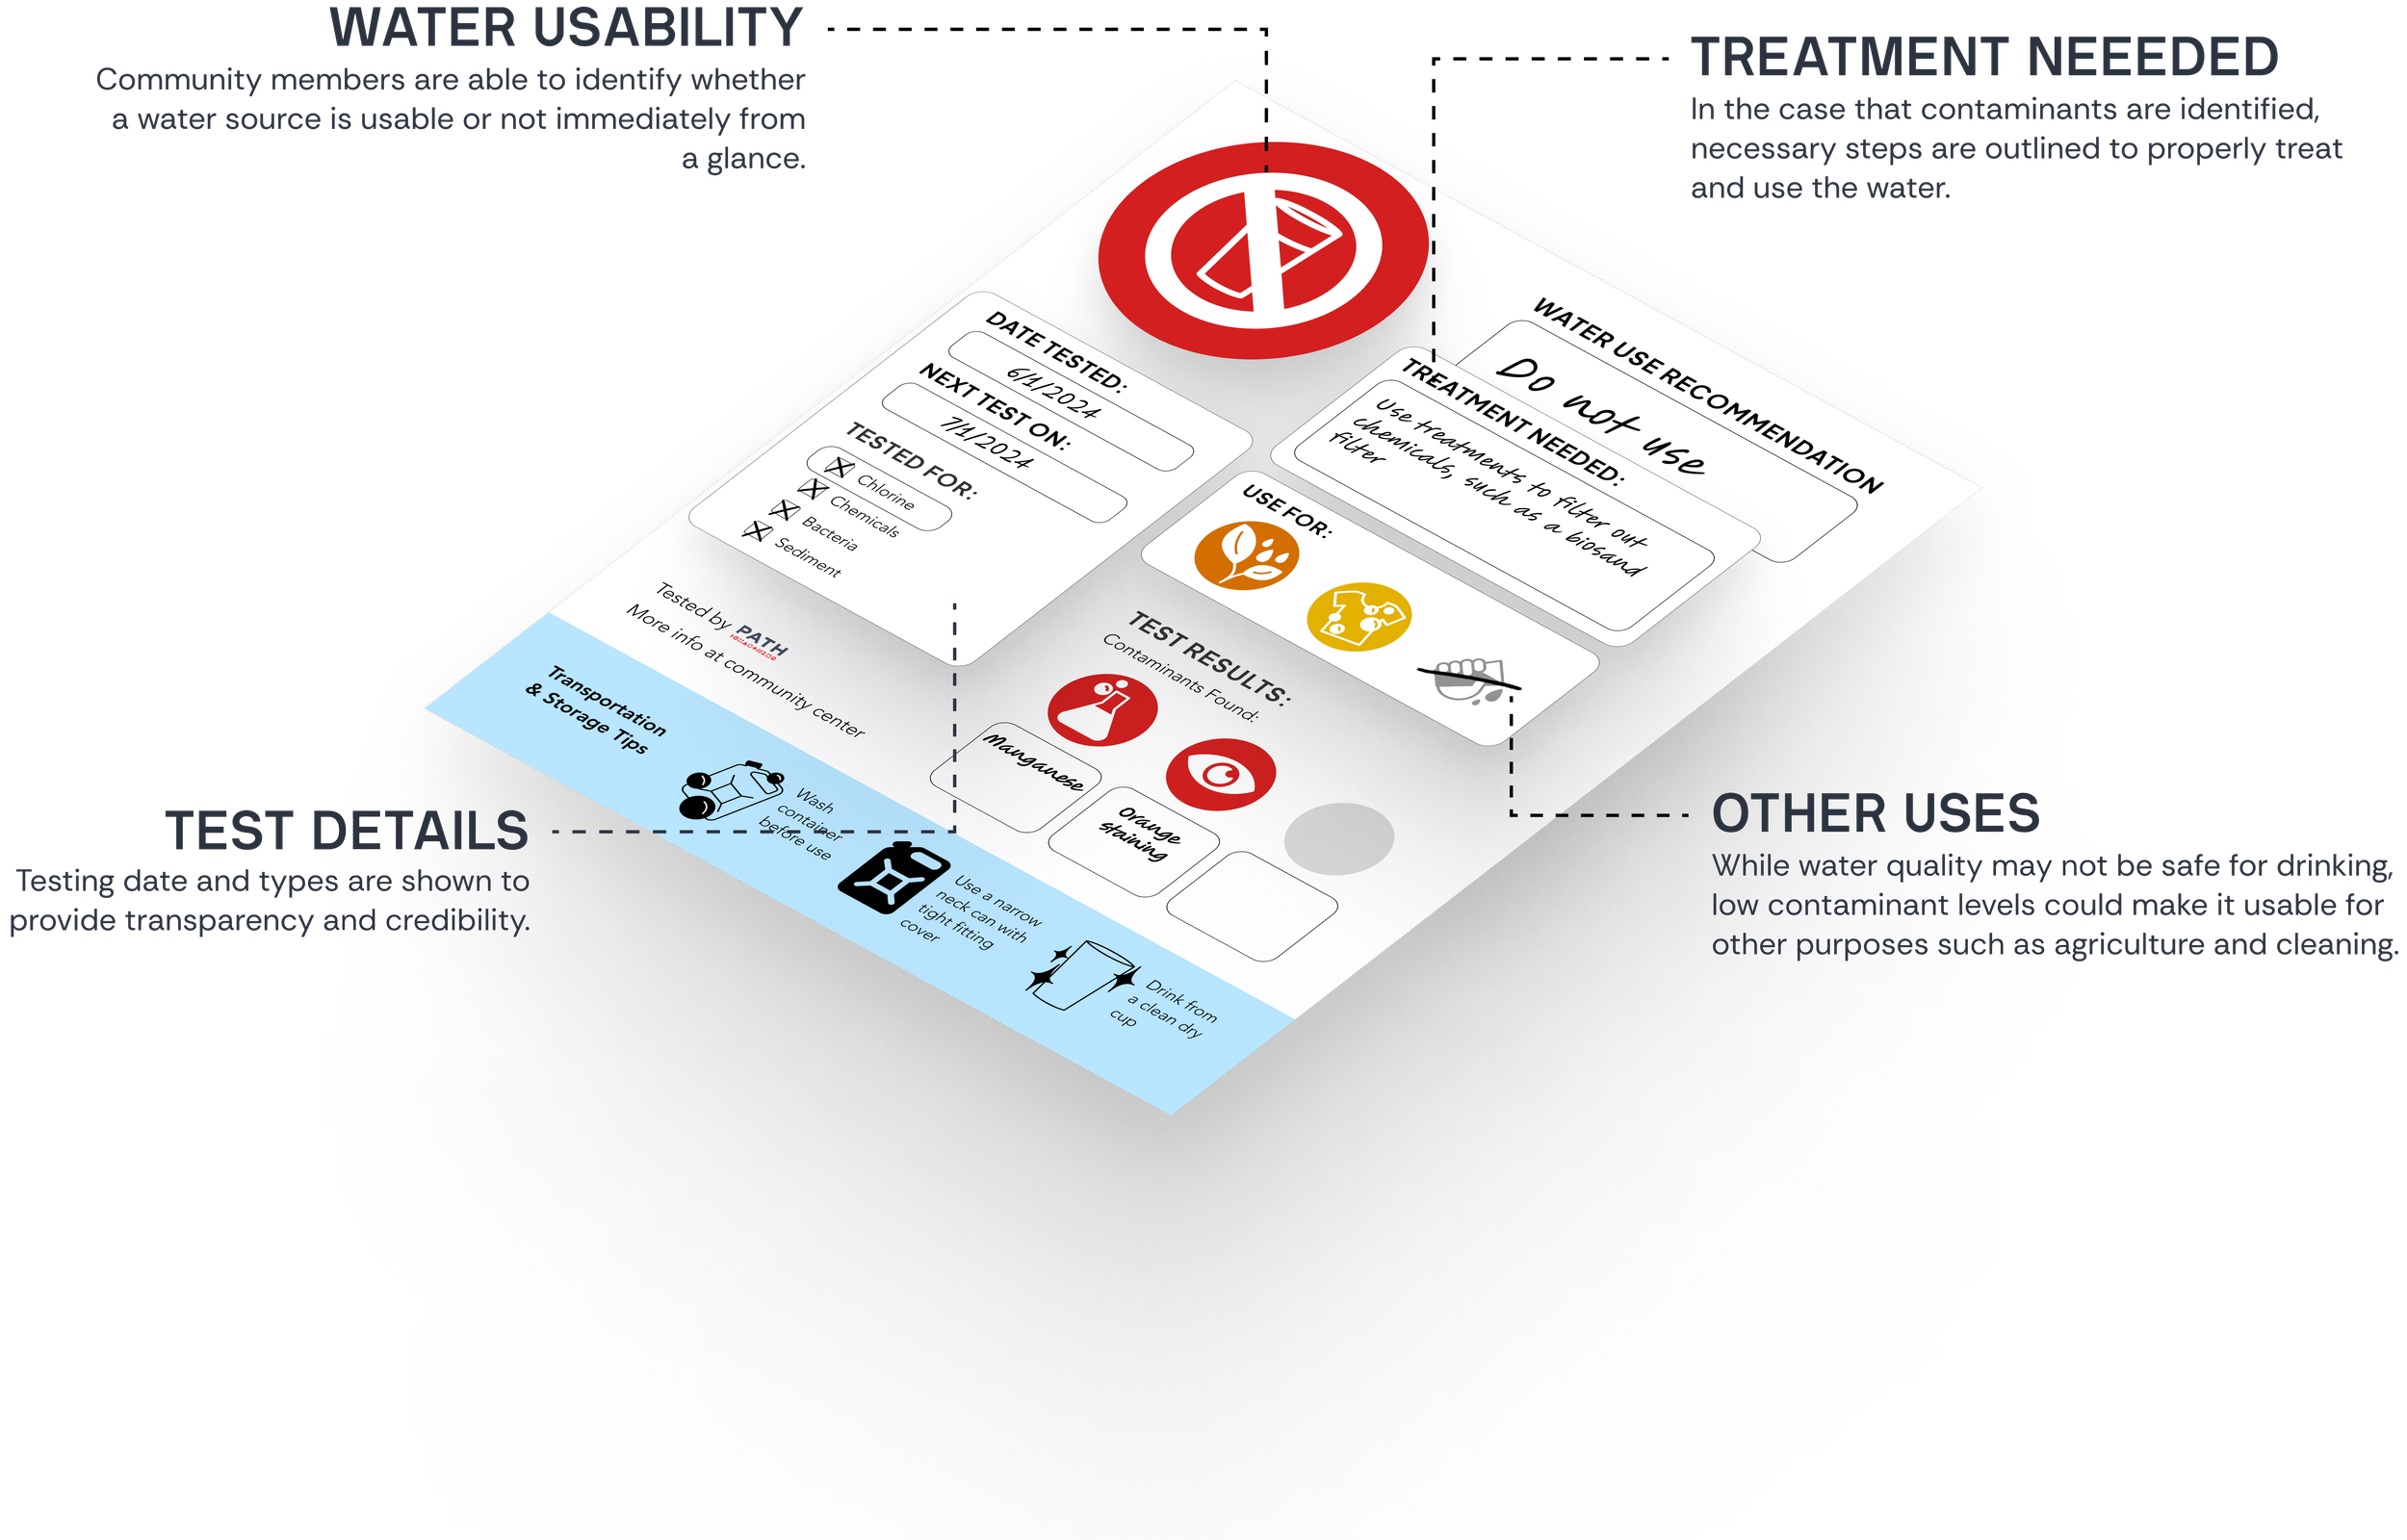
Based on our user research, we discovered that the educational levels in the communities in Ghana varied —and we needed to create signage that showed symbols without needing to be read.
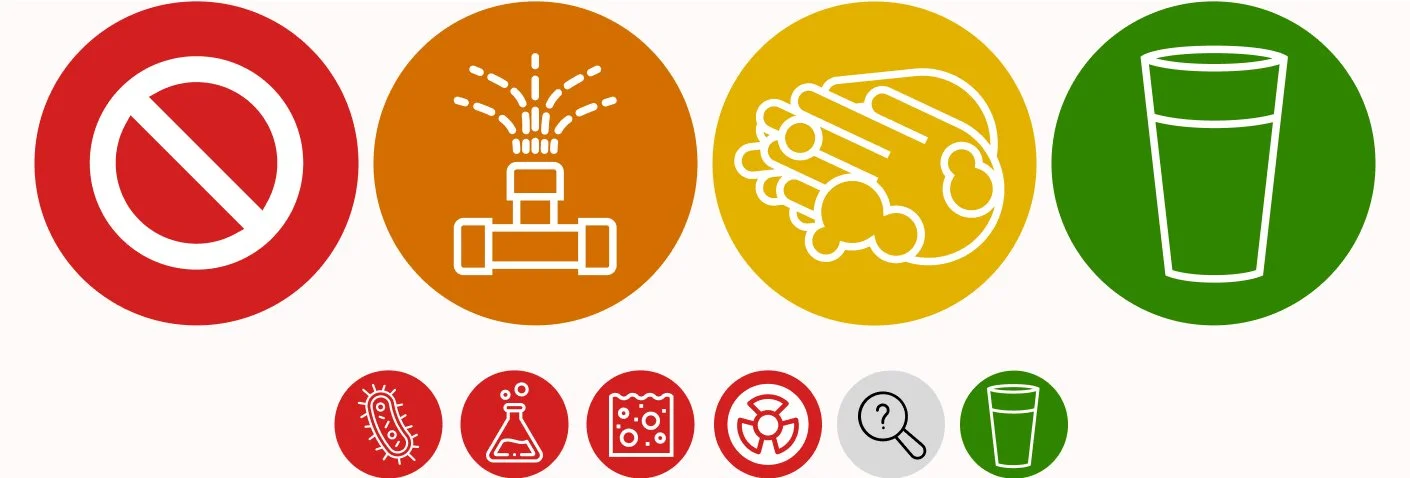
We prioritized big symbols (top left) that showed if water was drinkable or usable for different purposes, and symbols (bottom left) to show contamination so people would understand why the water is drinkable or not drinkable.
*I designed this signage prototype
Iteration of Icons Version One
Our first version of icons included four symbols for water quality, from not drinkable at all on the left, (do not use) to drinkable (far right). The orange icon indicated water could be used for cleaning, and the yellow icon indicated water could be used for hand washing.
Our contamination icons included four types of contaminants from the WHO guidlelines, from bacterial, chemical, physical (sediment), and nuclear contamination.
Icons Version Two
Through talking with users, we were able to refine our icons! We decided to change our icons in the top left of the signage/educational toolkit to reflect either being drinkable or not drinkable—since people are most likely either going to use it for everything, or nothing before treating it appropriately.
Our icons for contaminant types changed from 4 to 3— we combined chemical and nuclear contamination icons because users thought they were in the same category, and tweaked icons based on cultural context and other feedback.
Scenario Content Design for Educational Activity
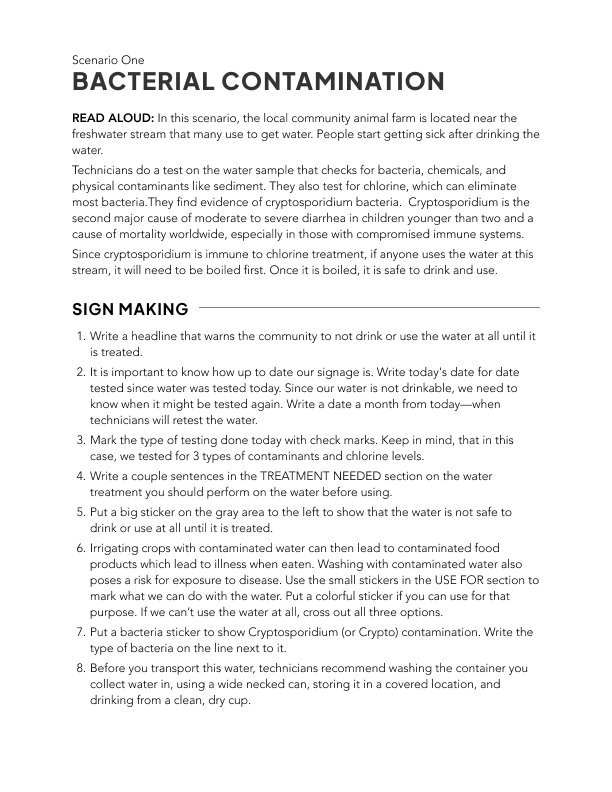
As a part of this design project, I collaborated with my team to create an educational toolkit, which included the design of an activity helping participants build their own signage. I designed three activity scenarios of contamination, bacterial, chemical, and physical.
Scenario Activity Design
I wrote and edited all the scenarios, which are designed to be read aloud by an instructor, while participants build their own signs on paper using stickers to reflect contamination, testing date, and type of testing done. I synthesized these scenarios from organizations like the WHO (World Health Organization) and reviewed them with experts at the University of Washington Safe Water Lab.
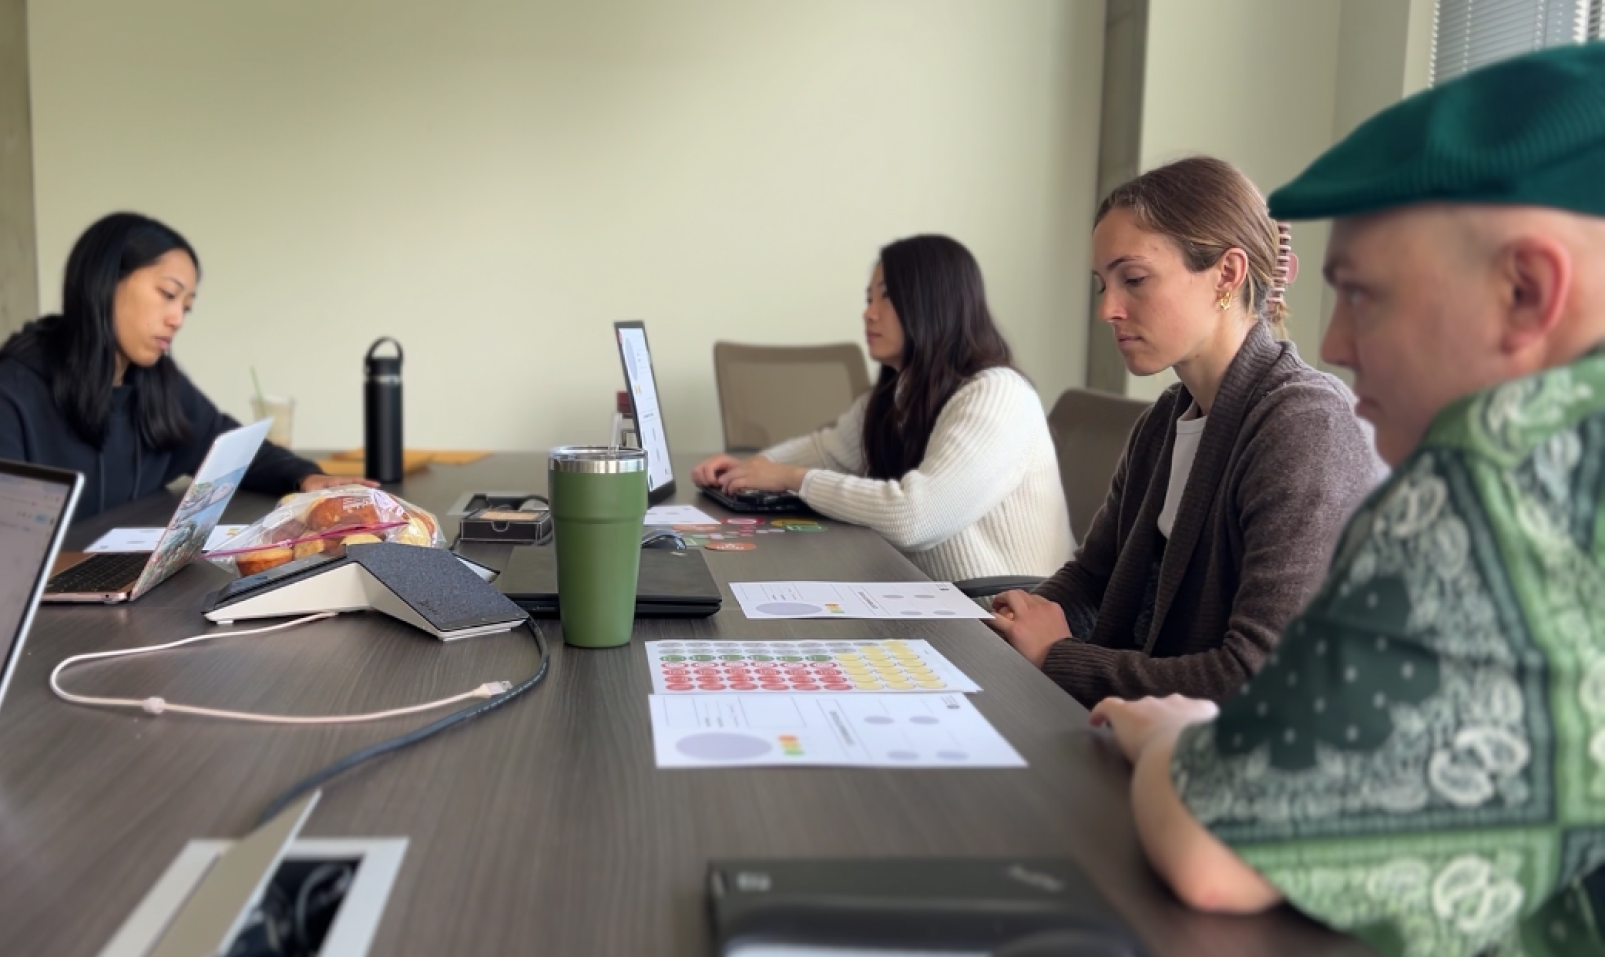
Focus Group Testing
We ran through these scenarios with focus groups, and made revisions to the instructions and signage layout to make the activity clearer.

Design Iterations
Ongoing critique and Design Process
Version 1
Final Version
Through usability testing with the clean water lab at the University of Washington, talking to our users in Uganda, and conducting focus groups at the PATH office, we iterated on our prototypes to target important information about communicating about water safety.
Focus Group Usability Testing
At the PATH office, we conducted in person focus group testing of our educational prototypes with two different groups. We gained insights such as
checkboxes were unclear for marking types of testing
we needed to consider printing ability and storage at community centers in Ghana
Each box should have a label on the blank sheets so participants could tell where the answers went
Final Signage Prototype
As a Designer
My Growth
Through this project, I learned how to
communicate across international borders to understand project needs
how to pivot project direction based on user research
consult with experts to create well-informed designs
conduct focus groups to test project ideas with different stakeholders